|
1)Magnetic Strip on STAC Card: The biggest noticeable change on the card is a magnetic strip on the back of the STAC card. You can now simply swipe the STAC card to add training and more. 2)Project Feature: The project feature has seen the greatest amount of change. Here are the new features on the project page:
 3)Spreadsheet updating of current employees: With the push of a button you can download and upload all employees in the STAC system to help streamline tracking employees and maintaining turnover and hiring processes.
4).CSV upload of training: Another feature to add in the streamlining of training upload is a mass .CSV upload of training information. This feature allows you to quickly add lots of training information from how you used to do tracking prior to STAC. 5)Role Administrator: Have special permissions for an employee or role that you would like? Well the role administrator easily allows us to custom make that role for you with a few clicks.
0 Comments
It could cost you over $32,500 a year to maintain paper records, and that's if only one person is maintaining them. That is $325,000 over a 10 year period! Electronic record keeping of documentation is 13 to 31 time more cost effective! As a core value of business, both in construction and other industries, most will rank safety as a top priority. In construction, many top contractors have accepted and implemented safety oriented cultures and programs to promote going home in the same way they came to work. STAC Enterprises is producing this report because we too believe safety should be a top priority for every business. By partnership in every safety culture, whether it be an industry association or individual companies, we look to set and improve the standard on safety accountability. In this report, information from the latest U.S. Bureau of Labor Statistics will be displayed and discussed to allow other contractors to use as a baseline to benchmark against. By making this information readily available and palatable on a local level, we can start the conversation to assist companies in a benchmarking process and improve awareness in the local area. Beginning on a national level, the report will then focus primarily on the Ohio, Kentucky, and Indiana “Tri-State” area. We want this report to be a conversation starter while encouraging our local industry associations to start benchmarking with one another and begin sharing as an industry how we bring these numbers down in the local area. As the information provided from the 2016 and previous years releases is primarily lagging indicators, the complete picture cannot be grasped without the help of additional contractor input. In future releases, the goal is to also obtain and reveal best practices from local contractors for other industry partners to emulate. Through collaboration and technology we can improve our local area by improving business practices and improving people’s lives. National OutlookNonfatal Information: In the latest Survey of Occupational Injuries and Illnesses, the private industry sector had an all-time low in the number of reported nonfatal workplace injuries and illnesses. Companies in 2016 reported nearly 48,500 fewer nonfatal injury and illness cases in 2016 than the previous year. This decline has been a continued pattern for over a decade. The construction industry also experienced an all-time reported low in incident rates per 100 full-time equivalent (FTE) workers. Below in Chart 1 the overall private industry is compared with construction and manufacturing over the last decade. 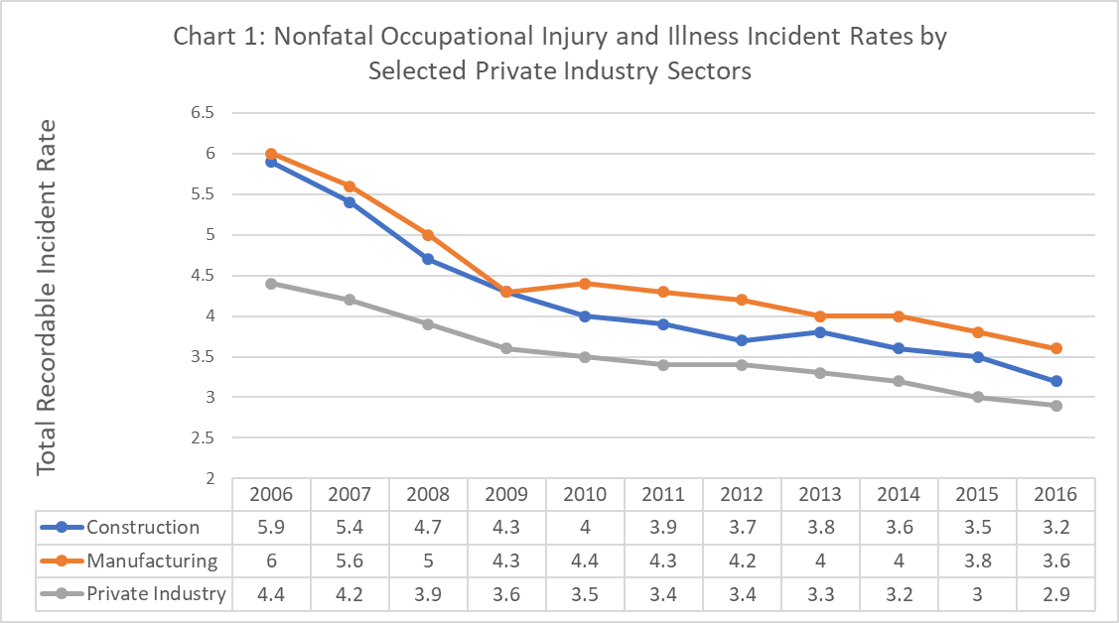 Although the total number of reported incidents were lower, the number of more serious occupational injuries and illness was slightly higher as the days away from work was essentially unchanged from 2015. In regards to construction, there were roughly 1,200 fewer reported occupational injuries, although the number of incidents with days away from work, job transfer, or restriction increased by roughly 3,000 from 2015 as seen in Table 1. The overall incident rates for both characteristics of incidents, days away from work, job transfer, or restriction and other recordable cases are both down for the year 0.1 and 0.2 respectively. 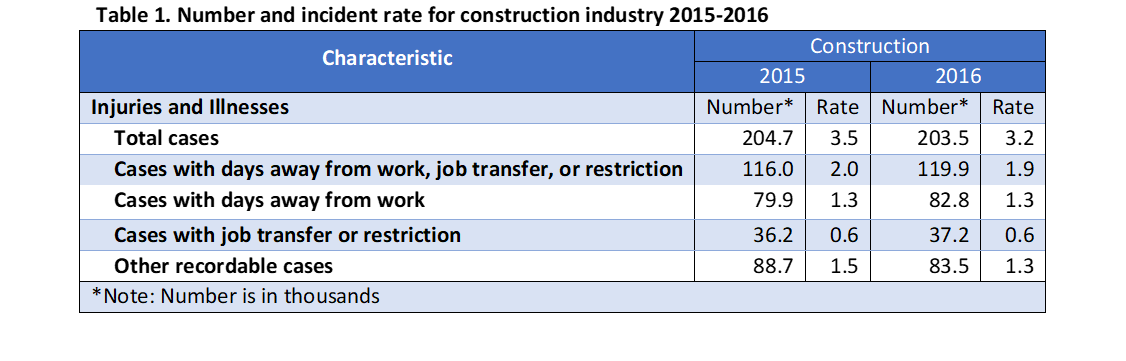 The question comes to mind, have we really gotten better, or just better at reporting? General contractors in an effort to reduce incident rates and improve response time are putting EMS professionals on site, which provides better first aid care to the individuals, yet essentially removes the smaller first aid reporting which would sometimes show on a OSHA Log. Likewise, employers have begun to seek more knowledgeable healthcare facilities which would choose to use first aid measures that are not recordable versus those which would have traditionally used stitches, or prescribed some type of medication or ointment. Does this explain the full picture or is there more for the story to tell? Seen as forward progress due to the lower incident rate, one would believe that the overall industry would be getting much safer although the next set of statistics may point in the opposing direction.
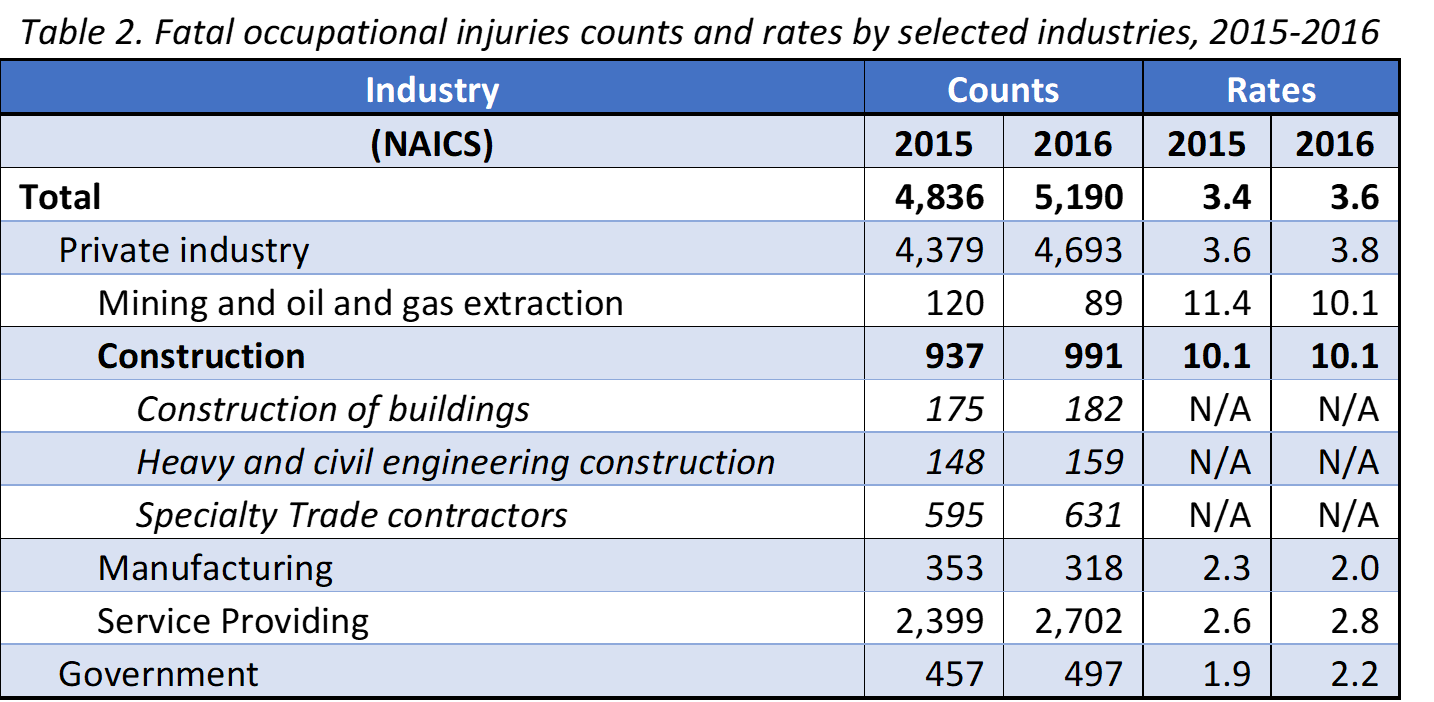
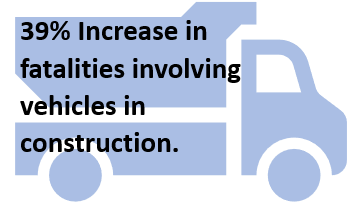 With an industry in need of skilled workers, those that would traditionally retire have continued to stay and work while the industry continues to recruit. Unfortunately, 2016 reported an increase in fatalities of construction workers over the age of 55. Vehicular accidents also increased by 39% for the construction industry meaning workers are increasingly being impacted on their commute to projects. This information may have also been the reason first line supervisors had the highest fatality count since 2003. The fatal four; falls, struck by, caught in between and electrocution once again claimed the most lives in 2016 for construction with nearly 2/3 of all fatalities. Occupations such as roofers and structural steel ironworkers experienced death counts of 101 and 16 respectively, both the highest counts since 2003 for each occupation. Lastly an increase in workplace violence contributed to such historically high rates in this decade. 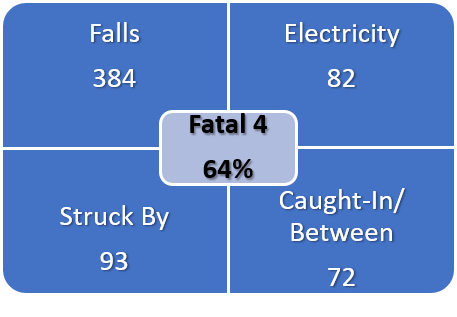 Although the fatality rates have remained the same for the industry as a whole, the loss of nearly 1,000 construction workers in a year is unacceptable and must be decreased. What can we do to decrease these numbers? Is it training and education, is it better equipment or tools, or is it culture that needs improved? Reports from Dodge Data and Analytics, as well as the Associated Builders and Contractors indicate that a strong safety program lead by upper management and shown by example have a strong correlation with reduced injuries and incident rates for contractors. Has your organization truly adopted the practices in which they claim to take to heart or is it another box to check for an owner, general contractor or compliance agency? How is this attitude locally? Tri-State Outlook (Ohio, Kentucky, and Indiana)Employment Information: The common theme of the Tri-State area is simple – as an industry we can’t find enough people to do more work. Seems like everyone is busier than a one armed wallpaper hanger. This information is reflected in the most recent employment and unemployment rates for the Cincinnati Area. Currently the construction industry employment in the Tri-State region is near the highs of 2008 at the beginning of the Great Recession shown in Chart 2. Employment for the construction industry has been on a steady climb from its lowest depression in 2010. This information also closely corresponds with the regional unemployment rate below the national average and the regional statewide averages. As seen in Chart 3, the Cincinnati Area unemployment rate dropped 5% or 0.2 from November 2016 to November 2017, less than the national average of 11%. With such an increase in work and employment, is the safety related information keeping in line with national standards? 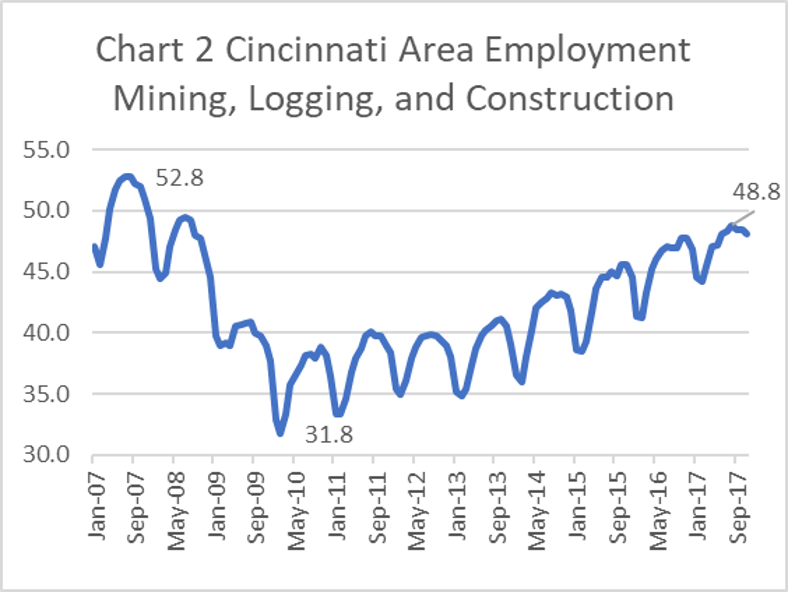 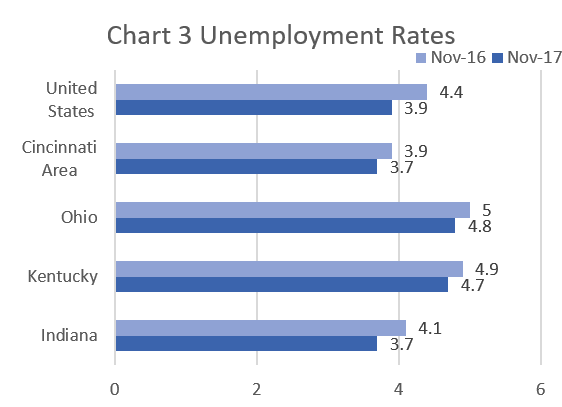 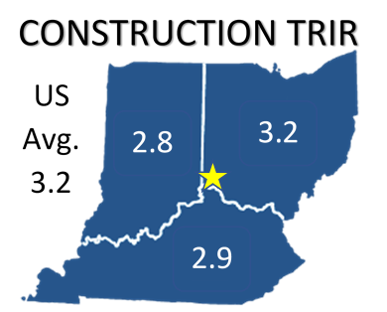 Safety Statistics: The three states, Ohio, Kentucky, and Indiana, within the tri-state region, all are at or below the national average for construction when it comes to total recordable cases (TRIR). The OSHA Recordable Incident Rate (or Incident Rate) is calculated by multiplying the number of recordable cases by 200,000, and then dividing that number by the number of labor hours at the company. Ohio, with the worst of the three states, matches the national average of 3.2. Kentucky, then Indiana come next in line with 2.9 and 2.8 respectively. Indiana also has the best average for specialty trade contractors at 2.9 which is below the national average of 3.5 Shown in the Reference Table below, one can see most of the individual trades or other sub-sectors of the industry are not reported on a state by state basis. Ohio though, has the best in the tri-state for highway construction and finishing contractors with rates of 1.9 and 1.4 which are well below the national average of 3.5 in both of those selected industries. Local contractors and industry association safety initiatives may be assisting the efforts to reduce overall incidents and safety indicators on local projects. Service in your local area, transparency between contractors, accountability within your organization and collaboration with local and regional trade associations is key for a strong safety culture. Take these statistics to heart and promote safe work practices today. As an industry we must remove our incidents, fatalities and the mindset that safety is not a top priority! 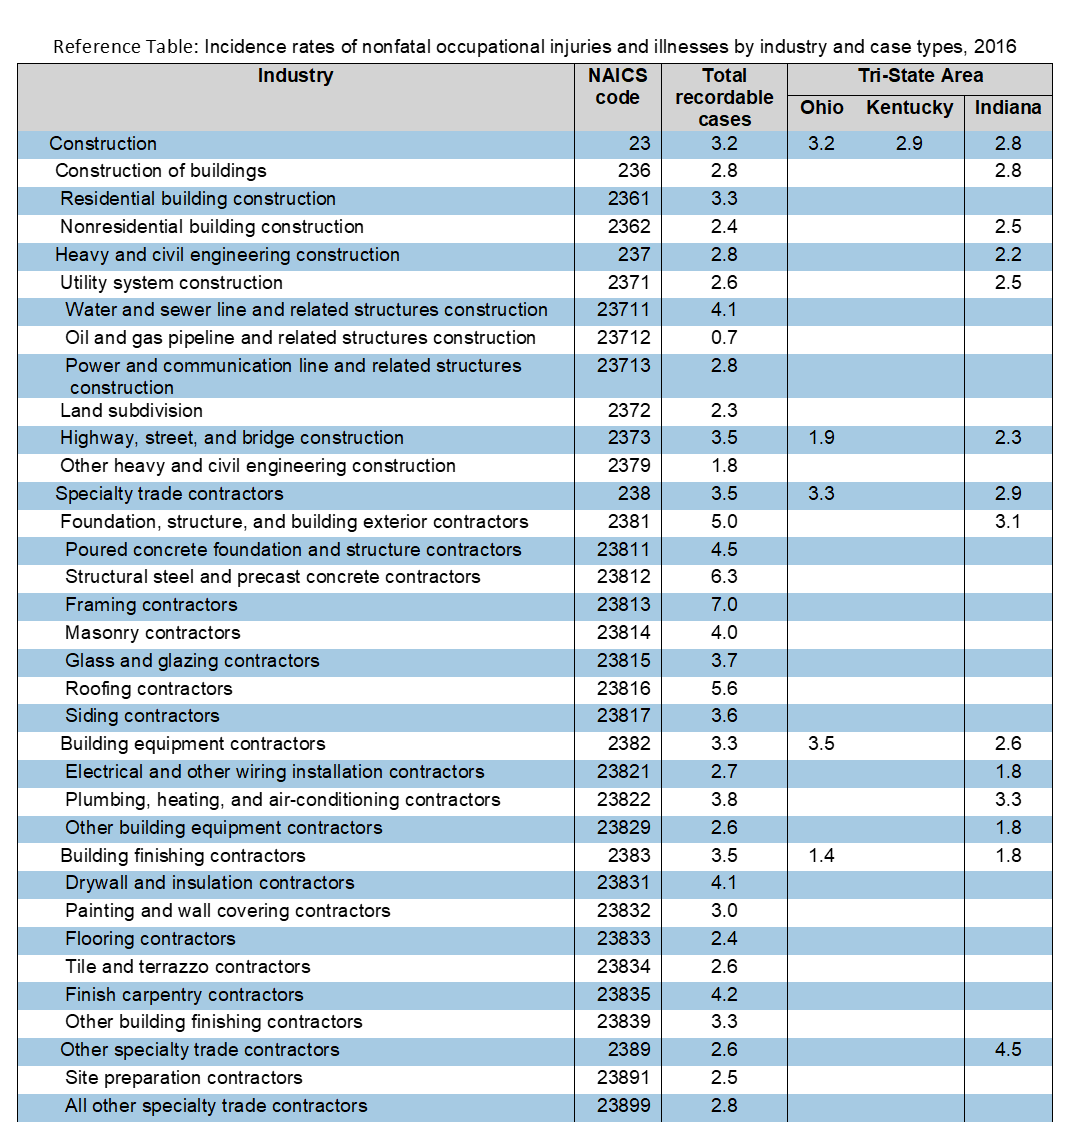  Without even realizing it we have entered a new industrial revolution. We are now living in the Digital Technology Revolution. These effects have already been seen in other industries, but the engineering and construction sectors have been slow to adopt to the new technologies. We are living in an adopt and overcome or resist and attempt to catch-up age. These trickling adaptations have currently been in use in the form of computer assisted drawing (CAD), 3D modeling and printers, electronic transmission of drawings and blue prints, and digital storage of records, to name a few.
However, no matter how slow the industry is to change the digitization of the construction sector will continue to grow and improve the industry through cost savings. It is estimated there could be as much as a 20% reduction in the total life-cycle cost of a project with improvements in time, quality, and safety. There is another estimate that full-scale digitization could save $0.7 trillion to $1.2 trillion in the Design & Engineering and Construction phases and a further $0.3 to trillion to $0.5 trillion in the operation phase. Many companies have not fully embraced with this untapped digital goldmine for many different reasons; mainly because change takes time. STAC represents just one nugget in this potential gold mine of untapped potential. STAC allows for the housing of your digitized training records, with each employee receiving a QR enabled card for the records to be at their fingertips. This system drastically cuts down on paper records and allows for peace of mind that records can be easily found and won’t get lost. The ability to run reports on training records and electronic storage has the potential to save thousands in production and material. If you are interested in investing in the new age of technology, let us know. And we can show you how STAC can save you money. |
AuthorSTAC Admin Categories
All
Archives
July 2024
|
 RSS Feed